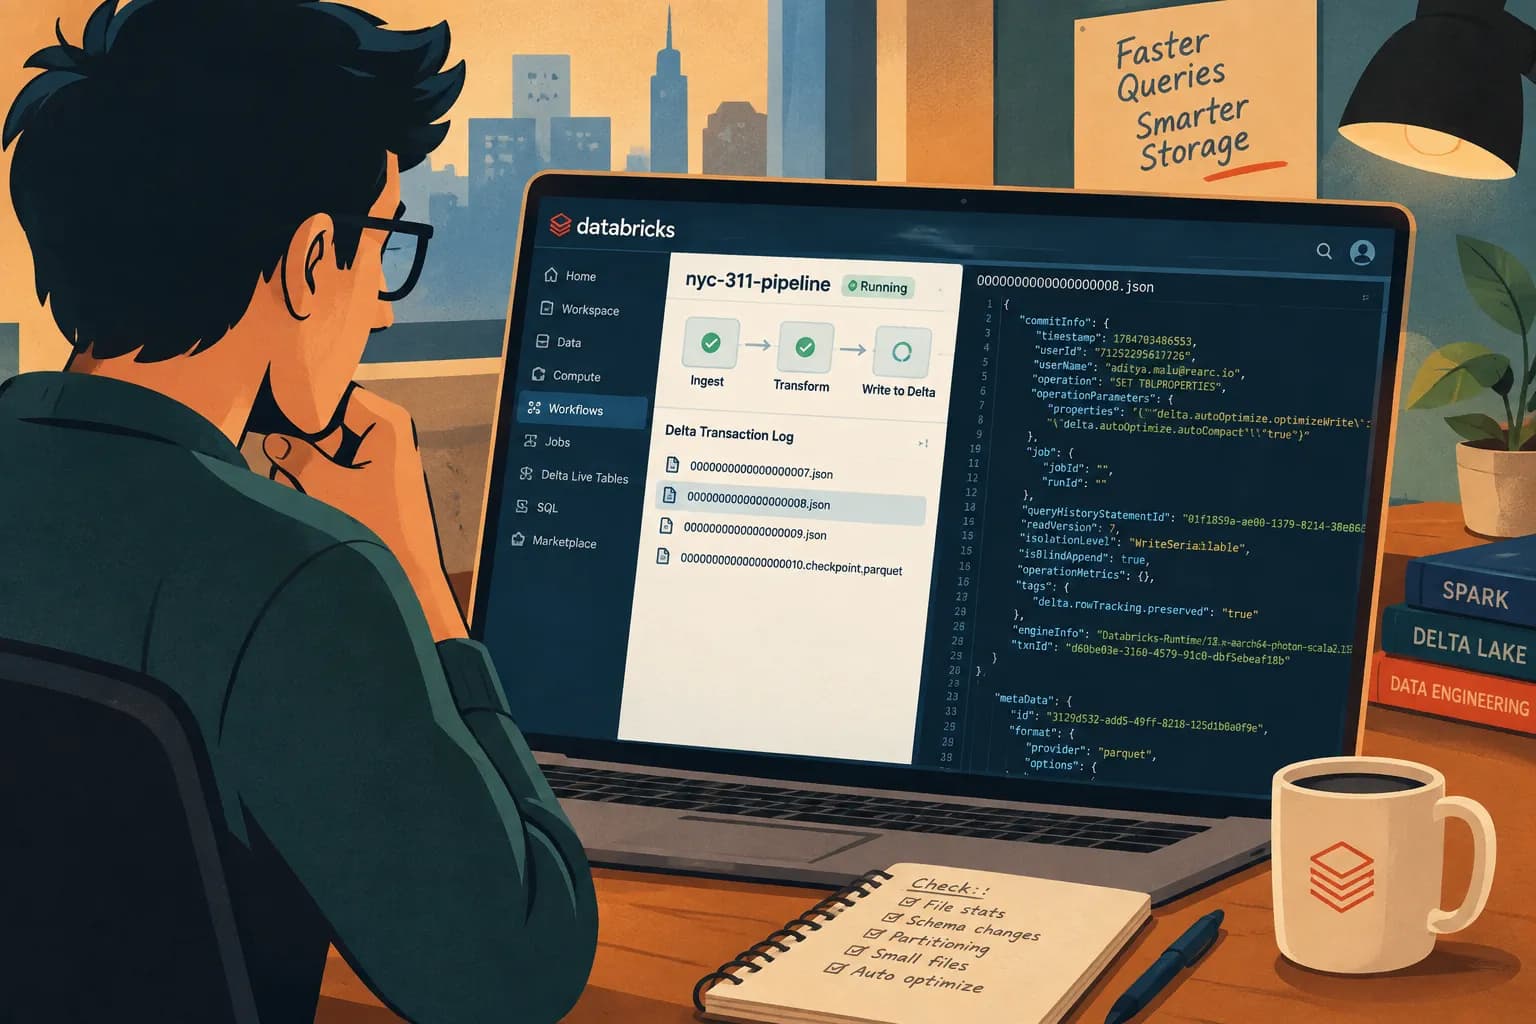
Photon speeds up the rows it touches. The Delta transaction log decides which rows it never has to touch.
When Databricks compute is slow, the quick fix is to enable Photon on it. Photon is Databricks' vectorized C++ execution engine: it processes rows in batches of columns rather than one at a time, which cuts query time substantially on the right workloads. Predictive I/O is a Photon feature that uses learned access patterns to skip reads Photon would otherwise perform. Adaptive Query Execution (AQE) is not part of Photon. It is core Spark, on by default, and rewrites the query plan mid-flight once it sees real data.
This post walks you through a layer where you can improve your job without using Photon or AQE. Just the _delta_log/ files themselves: what's recorded in them, what they tell you about your table, and how reading them directly helps you find and fix problems those other layers can't capture.
What's in _delta_log/ — and How We'll Read It
Every Delta table is just a folder of Parquet data files with one special sub-folder next to them _delta_log/. This folder is a collection of JSON files that record which files currently belong to the table, how the data is laid out in the table and a complete history of all changes.
my_table/
├── part-00000-....snappy.parquet   ← actual data
├── part-00001-....snappy.parquet
└── _delta_log/
    ├── ...0000.json                ← commit 0, one action/line
    ├── ...0001.json                ← commit 1
    ├── ...
    ├── ...0010.checkpoint.parquet  ← snapshot every 10 commits
    └── _last_checkpoint            ← newest-checkpoint pointer
These are the two fundamental things to remember when it comes to the transaction log:
Each numbered .json file is exactly one commit, and each line inside it is one action, a small JSON object describing one thing that happened.
The data files are never modified in place. A change means writing new files and marking the old ones as removed in the log. The log itself is append-only too: each commit is a new JSON file, numbered in sequence, so together they hold a complete history of the physical layout, not just its current state.
The actions that matter for performance tuning:
Action
What it tells you
add
A data file was added, along with its size and per-column min/max/null stats.
remove
A data file was marked as removed (by a rewrite, OPTIMIZE, or VACUUM).
commitInfo
The operation and its metrics like numTargetFilesAdded/Removed, deletion-vector counts, rows touched.
metaData
Schema, partition columns, and table properties.
*.checkpoint.parquet / _last_checkpoint
A snapshot of the table's current file list, saved as Parquet so a reader can skip replaying every JSON commit. _last_checkpoint points to which one to use. This is what makes state reconstruction cheap.
import json, glob, os
defread_commit(log_dir, version):withopen(f"{log_dir}/{version:020d}.json")as f:# one action per linereturn[json.loads(line)for line in f]
Note: Unless your Identity and Access Management (IAM) principal can read the underlying cloud storage directly, the preceding code won't run against a Unity Catalog managed table. Managed storage sits under a reserved path that rejects path-based reads. You can use an alternative approach below to apply every fix in this post, but it doesn't give you the per-file statistics to tell you which problem you have.
It processes data in batches of columns, not one row at a time — so a filter or aggregate runs down a tight array of values.
That layout lets the CPU process many values at once instead of one at a time, and keeps related data close together so it's faster to access.
Native memory management means no JVM garbage-collection pauses mid-scan.
For heavy CPU work like scanning, filtering, joining, and aggregating rows, Photon is a real speedup, sometimes several times over.
Now look at what Photon actually gets handed. By the time Photon runs, the planner has already decided which files to open and which rows survive pruning. Photon starts after those decisions are made. It has no control over how many files or rows it reads.
The bottleneck this post addresses is how much data gets read, how many files exist, missing statistics, or slow planning. All of that is decided by the table's Delta log.
The Layer Cake: Photon, the Spark Optimizers, and the Log
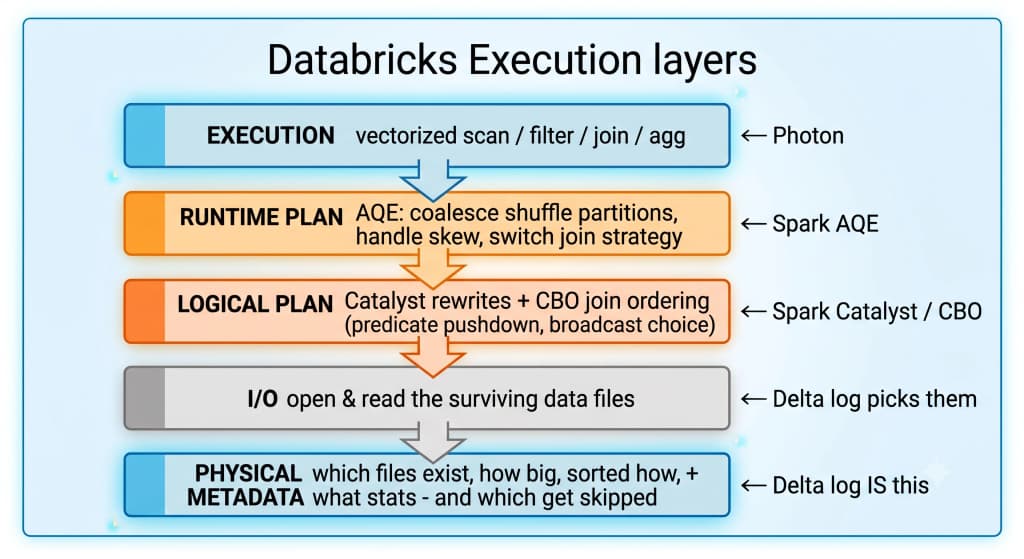
The Databricks execution layers stacked top to bottom: Execution (Photon), Runtime Plan (Spark AQE), Logical Plan (Catalyst and the cost-based optimizer), I/O (where the Delta log picks the files) and Physical Metadata, which is the Delta log itself.
Photon executes the plan it's given.
AQE reshapes shuffles at runtime. It coalesces small shuffle partitions and fixes skew.
Catalyst (Spark's built-in query optimizer) pushes your WHERE down to the Delta scan. The min/max statistics captured in _delta_log/ then decide which files get read.
Tuning a Spark job therefore means two different things:
Photon and the Spark optimizers make the given work faster.
The Delta log changes how much work there is in the first place, and every layer above it benefits.
How to use the Delta Log to improve performance
1. Pruning and Clustering: Make Ranges Narrow Enough to Skip Files
Every time Delta writes a data file, it adds an add action to the log describing that file. Part of that record is a statistics blob holding, for each column, the smallest value in the file, the largest value, and how many nulls it has. Delta collects this for the first 32 columns of the table by default.
Delta stores that blob as an escaped JSON string rather than a nested object, which is why the code below parses it twice.
Those minValues and maxValues are the entire basis for skipping a file, and two things have to go right. The column you filter on has to be one Delta collected statistics for. And the range it recorded has to actually exclude something. In the record above, agency runs from A to Z. Whatever value you filter for sits somewhere inside that span, so Delta cannot prove this file is safe to skip.
VERSION =5# the commit to inspectCOLUMN ="agency"for action in read_commit(LOG_DIR, VERSION):if"add"notin action:continue stats = json.loads(action["add"]["stats"]) lo = stats["minValues"].get(COLUMN) hi = stats["maxValues"].get(COLUMN)if lo isNone:print(action["add"]["path"][:19],"no statistics")else:print(action["add"]["path"][:19], lo,"to", hi)
part-00000-7f069a4a A to Z
part-00001-2b1c8d3e A to Z
part-00002-9e4f7a1b A to Z
Every file reports the same range, which is exactly the problem. The statistics exist, they just aren't selective, because values for agency are scattered across every file.
If the column had never been indexed the loop would print no statistics instead. Delta indexes the first 32 columns by default, controlled by delta.dataSkippingNumIndexedCols, so a filter on the 48th column of a wide bronze table scans everything no matter how selective it looks.
These are two different problems with two different fixes. Missing statistics need the column indexed. An end-to-end range needs the data rearranged.
What to do:
Filter on a column you already partition or cluster by, before reaching for anything else.
Index a late column explicitly: ALTER TABLE ... SET TBLPROPERTIES ('delta.dataSkippingStatsColumns' = '...') (only affects files written after the change).
Fix the layout itself with OPTIMIZE ... ZORDER BY (agency) or ALTER TABLE ... CLUSTER BY (agency) for Liquid Clustering, so ranges become narrow and disjoint instead of overlapping.
How to confirm it: Re-read add.stats on freshly written files. The column should now appear in minValues/maxValues, and ranges should tighten from overlapping ("A" → "Z") to disjoint ("A" → "M", "N" → "Z"). Files pruned should noticeably increase in the query profile.
2. Small Files: Every File Carries a Fixed Cost to Open
Each file is a storage open and a task to schedule, regardless of how few rows it holds. Frequent small writes, especially MERGE, tend to produce a lot of tiny files over time.
File count isn't visible in any single snapshot. It only shows up as a trend across commits.
for path insorted(glob.glob(f"{LOG_DIR}/*.json")): v =int(os.path.basename(path).split(".")[0]) acts =[json.loads(l)for l inopen(path)] adds =[a["add"]for a in acts if"add"in a] rems =sum("remove"in a for a in acts) info =(a["commitInfo"]for a in acts if"commitInfo"in a) op =next(info,{}).get("operation","?") tiny =sum(1for a in adds if a["size"]<1_000_000)print(f"v{v:<3}{op:<10} "f"+{len(adds)}/-{rems} ({tiny} under 1MB)")
v5  MERGE      +20/-16 (20 under 1MB)
v6  MERGE      +19/-2  (19 under 1MB)
v10 OPTIMIZE   +3/-78  (0 under 1MB)
Two things jump out. First, the file count keeps climbing across the MERGE commits, and almost every file added is under 1MB. Second, OPTIMIZE at v10 is the reverse: it removed 78 tiny files and left just 3 behind. That climb-then-collapse pattern is the fragmentation signature.
What to do:
Run OPTIMIZE as a deliberate compaction pass.
Set delta.autoOptimize.optimizeWrite = true to bin-pack at write time, and autoCompact = true to coalesce after writes.
Turn on delta.enablePredictiveOptimization = true and let Databricks schedule this automatically.
If the root cause is over-partitioning a low-cardinality column, stop partitioning it.
How to confirm it: Check dt.detail().numFiles before and after, or watch for a large negative remove count in the OPTIMIZE commit.
3. MERGE Write Amplification: A Few Changed Rows, a Lot of Rewritten Data
Delta never edits a data file in place. To change one row it writes a fresh copy of the whole file that row lives in, and marks the old file as removed. That is copy-on-write. A MERGE touching a handful of rows can therefore rewrite gigabytes, because every file holding one of those rows gets rewritten in full.
VERSION =5# the MERGE commit to inspectfor action in read_commit(LOG_DIR, VERSION):if"commitInfo"notin action:continue m = action["commitInfo"]["operationMetrics"]print(m["numTargetRowsUpdated"],"rows changed")print(m["numTargetFilesRemoved"],"files removed")print(m["numTargetFilesAdded"],"files written")
70 rows changed
16 files removed
20 files written
70 rows changed, 16 files rewritten. If we assume 64MB a file, that's roughly 1GB moved to change 70 rows. Cross-checking those 16 files' key ranges against the incoming batch (the same stats from lever 1) usually shows the ranges overlap broadly, which is why Delta couldn't localize the change.
What to do:
Add a predicate to the ON clause that maps to a partition or clustering column, so old partitions get skipped entirely before any rewrite happens.
Cluster or Z-order the target on the merge keys so matching rows sit together in fewer files.
Turn on delta.enableDeletionVectors = true so a small update marks rows instead of rewriting whole files.
How to confirm it: Re-run and check operationMetrics again. numTargetFilesRemoved should drop sharply, and numTargetDeletionVectorsAdded should rise above zero if deletion vectors are on.
4. Query Startup: How Far Back a Reader Has to Replay
Before any query runs, a reader has to reconstruct the table's current state by replaying the log from the last checkpoint forward. If that checkpoint is old and hundreds of commits have piled up since, the reader pays for all that replay before the query even starts.
last = json.load(open(f"{LOG_DIR}/_last_checkpoint"))print("checkpoint at v", last["version"])
A large gap between the checkpoint version and the newest commit means every startup walks a lot of JSON. A bloated active-file count (dt.detail().numFiles) also means a heavier checkpoint, which loops back to the small-files problem above.
What to do:
Keep the active-file count down. Fewer files means a smaller, faster checkpoint.
delta.checkpoint.writeStatsAsStruct = true keeps pruning stats in a fast, columnar form inside the checkpoint. Checkpoints themselves are written automatically every 10 commits by default.
How to confirm it: _last_checkpoint version should sit close to the table's current version.
5. Skew: An Uneven Distribution Baked Into the Files
One file or partition holding far more rows than the rest can make a single task run longer than other tasks.
VERSION =5# the commit to inspectcounts =[]for action in read_commit(LOG_DIR, VERSION):if"add"notin action:continue stats = json.loads(action["add"]["stats"]) counts.append((stats["numRecords"], action["add"]["path"][:19]))for rows, path insorted(counts, reverse=True)[:5]:print(f"{rows:>8}{path}")
An uneven spread like that, or one partition value dominating the counts, is skew, quantified before you rerun anything.
What to do:
Pick a higher-cardinality or more even partition or clustering key.
Repartition or salt the skewed key before writing, so rows spread across files more evenly.
How to confirm it: Re-read numRecords across files after the rewrite. The spread should flatten out.
A Caveat About Unity Catalog Managed Tables
Everything that reads the raw log files directly — add.stats, commitInfo metrics, _autostats, _last_checkpoint — needs path-based access to _delta_log/. On a Unity Catalog managed table, that specific access pattern is blocked: the managed storage location lives under a reserved path (__unitystorage/catalogs/<id>/tables/<id>/), and any direct list or read against it fails with INVALID_PARAMETER_VALUE.LOCATION_OVERLAP, because catalog and schema storage locations are reserved for managed storage and don't support path-based access (Databricks KB; Databricks docs).
The log itself is still there. What you lose on a managed table is direct access to its raw JSON, not the log's existence. In its place you get the API and SQL layer: dt.history(), dt.detail() (numFiles, sizeInBytes, properties), the _metadata file-layout trick, the Spark UI query profile, and every ALTER TABLE / OPTIMIZE / ANALYZE fix covered above, all of which read the log internally without exposing it to you directly.
Summary
Photon is a faster engine for the work you do. The transaction log is how you stop doing work you never needed to. The biggest speedups usually aren't a faster engine, they are the files Photon never had to open, and that gets decided at the _delta_log/ layer.
Next time a job is slow, before reaching for a bigger cluster or toggling Photon, open the log. Count the files. Read the statistics. Half the time the answer is too many files, no statistics on the filter column, or an ON clause that rewrites the world, and it has been sitting in a _delta_log/.json file the entire time.
Latest Articles
Read more about the latest and greatest work Rearc has been up to.